Content

This page explains the natural processes that pose coastal erosion and flood risks to Exmouth, as well as an overview of the condition of the town's sea defences. The information on this page was presented on boards at the first Exmouth BMP Update drop-in event at the Town Hall on 15 February.

Exmouth’s coastal processes

Coastal processes are the ways tides, currents, waves, and sediment interact around the shoreline. Sediment is transported around the coastal system which leads to erosion and accumulation in different areas at different times.

These natural processes are responsible for the dynamic nature of Exmouth Beach, where sand accumulates and erodes over time, causing beach levels to raise and lower.

A map of a section of Exmouth beach. A dark blue line represents 30 metres squared of accumulation, a grey line represents no change, and a dark red line represents 30 metres squared of erosion. There are 10 lines. (West to East) #1 light blue line 6a01800 (12%); #2 light red line 6a01796 (-2%); #3 red line 6a01792 (-13%); #4 light red line 6a01788 (-8%); #5 light blue line a01784 (10%); #6 grey line 6a01783 (0%); #7 blue line 6a01780 (64%); #8 blue line 6a01776 (22%); #9 blue line 6a01772 (10%); #10 red line 6a01767 (-6%)

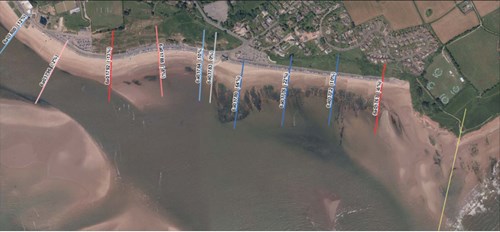
The picture above (from the South West Regional Coastal Monitoring Programme Annual Report 2022) shows changes to Exmouth beach, with accumulation shown with a blue line, and erosion shown with a red line.

Sediment transport processes

Map of Exmouth seafront. At the top there is an arrow from the Estuary with the text: ‘deep water channel eroding northwest’; There is a text box on Dawlish Warren: ‘The spit erodes due to high velocity flood tides, with some sediment returned on the ebb tide’. There is an arrow North East along the sea at the Warren and a U-turn arrow above that. Below the arrow is the text ‘beach material is transported north east by wave action’. There is an arrow along the seafront south-east. In the bottom right corner is a textbox ‘transport processes (based on BMP 2015)

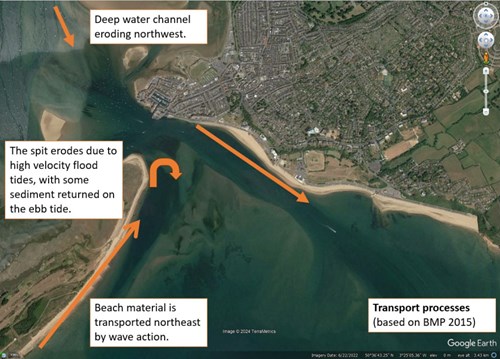
The picture above illustrates how sediment is transported along Exmouth’s seafront.

Areas of sediment accumulation

Map of Exmouth seafront. In the Estuary is a text box 'accretion over flood delta' - below this is a green arrow pointing west. To the west, beyond the marina is a text box 'accretion over Pole Sands' - below this are two arrows pointing south-west out to sea. Below this, over the Warren, is a text box 'accretion to the south of pole sands - to the right are three arrows - one pointing south-west, one south, and one south-east. To the east is a text box reading 'Tidal eddy to east of Maer Rocks aids accretion'. Below that is a u-turn arrow from east to west. Below this, to the right is another text box reading 'accretion to the east of Pole sands'. An arrow to the left points south-east. Below this is a textbox reading 'accretion processes (based on BMP 2015)

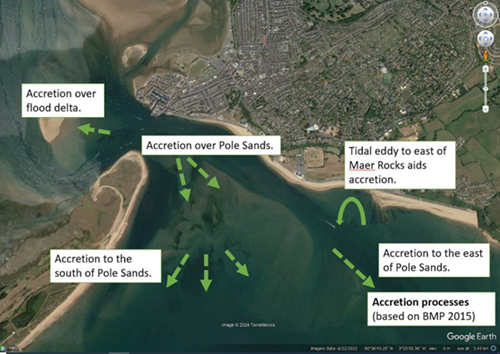
The picture above illustrates the areas where sediment accumulates.

Influence of tides

Google Earth image of Exmouth. Over Dawlish Warren is a text box reading 'partly sheltered from waves by Pole Sands. Tidally dominated transport'. There are yellow lines along the Warren's shore. Over Exmouth is a text box reading 'partly sheltered from waves by Pole Sands. Tidally dominated transport. There are yellow lines along the beach from the Marina side to by Sideshore. In the bottom right hand corner is a text box reading 'tidally dominated processes (based on BMP 2015)

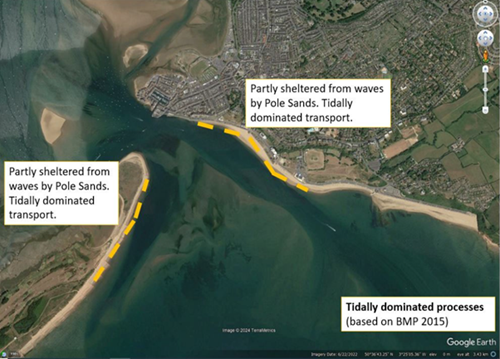
The image above shows the areas where sediment transport is driven by the tides.

Influence of waves

Google Earth image of Exmouth. Textbox above Dawlish Warren reading 'westward wave driven currents from Pole Sands interact with northward wave driven currents, leading to some offshore transport. Sediment recirculated on shore for some wave conditions. There are two arrows from the sands at Dawlish Warren, out to sea. There are two long arrows from the sea, westwards towards the sands at Dawlish WarrenText box above the marina reading 'some recirculation of sediment into the estuary', with an arrow pointing from the sea to the estuary. A textbox in the sea below Exmouth reads 'Westward wave driven currents lead to net westward transport'. Above that is a westward arrow along the beach at Exmouth. In the bottom right corner is a textbox reading 'wave driven processes (based on BMP 2015)

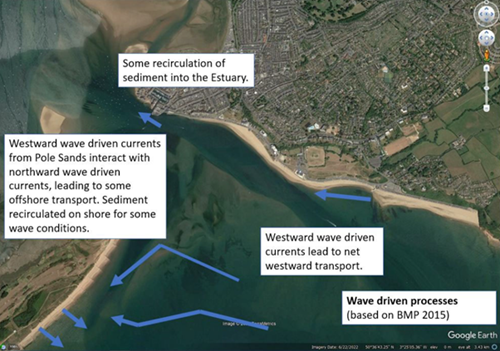
The image above shows the areas where sediment transport is driven by waves.

Exmouth’s coastal defences

Exmouth’s BMP Update is looking at the current condition of the town’s sea defences, how they are performing now and how they will perform in the future, considering the impact of rising sea levels. The condition of the defences generally ranges from poor to good.

The beach provides protection to the toe of the sea defences, helping to minimise the energy of waves before they are hit.

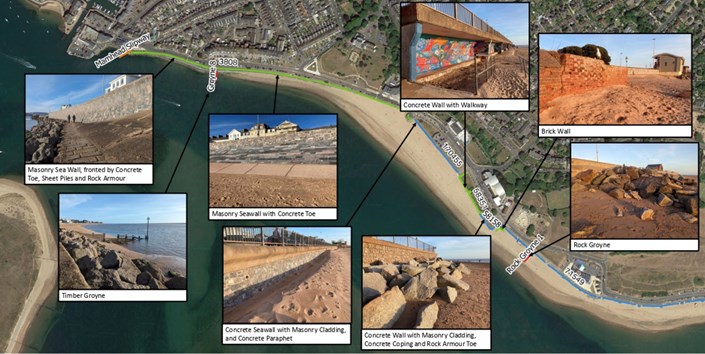
The picture below illustrates the existing sea defences from Exmouth Marina to The Maer:

  1. Masonry Sea Wall, fronted by Concrete Toe
  2. Sheet Piles and Rock Armour
  3. Timber groye
  4. Masonry seawall with concrete toe
  5. Concrete seawall with masonry cladding, and concrete paraphet
  6. Concrete wall with walkway
  7. Concrete wall with masonry cladding, concrete coping and rock armour toe
  8. Brick wall
  9. Rock groyne

Alt text: Map of Exmouth seafront from Exmouth Marina to The Maer. There are photos of the sea defences with textboxes providing written details. (West to East) Masonry Sea Wall, fronted by Concrete Toe, Sheet Piles and Rock Armour; timber groye; masonry seawall with concrete toe; concrete seawall with masonry cladding, and concrete paraphet; concrete wall with walkway; concrete wall with masonry cladding, concrete coping and rock armour toe; brick wall; rock groyne

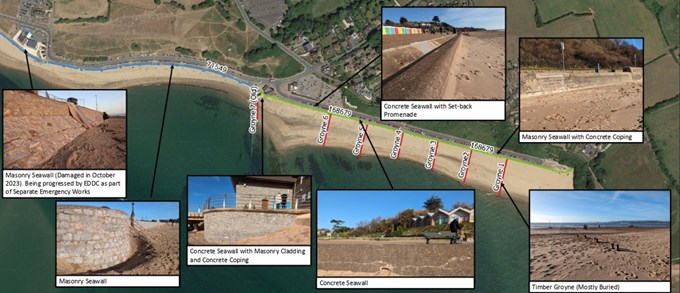
The picture below shows the existing sea defences from The Maer to Orcombe Point:

  1. Masonry seawall (damaged in October 2023). Being progressed by EDDC as part of separate emergency works
  2. Masonry seawall
  3. Concrete seawall with masonry cladding and concrete coping
  4. Concrete seawall with set back promenade
  5. Concrete seawall
  6. Masonry seawall with concrete coping
  7. Timber groyne (mostly buried)

Map of Exmouth seafront from The Maer to Orcombe Point. There are photos of the sea defences with textboxes providing written details.